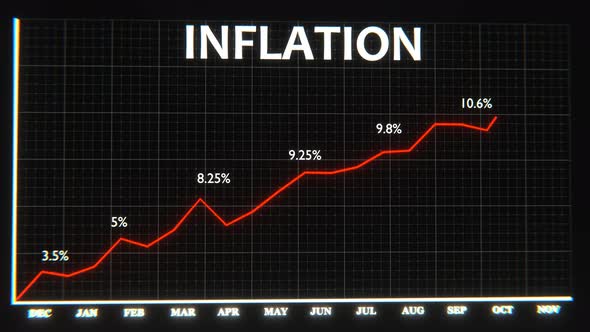
This animated visual displays a dynamic line graph charting inflation rates over a twelve-month period. A vibrant red line progressively draws across a dark grid, marking significant percentage points from December to November. The clear, modern design highlights key data fluctuations, with numerical values appearing at peak points along the line, providing precise information. The word ‘INFLATION’ is prominently featured at the top, emphasizing the graph’s focus. This data visualization is ideal for economic analyses, financial reports, business presentations, or news broadcasts requiring a clear and engaging representation of statistical trends. The clean aesthetics make it suitable for a professional and informative context.
Explore more high-quality resources in our Graphics & Illustrations library, and pair them with curated Graphic Templates and Web & Site Templates for your digital creations.
📋 Asset Specifications & Compatibility
Original creative preview & visual showcase
⚡ High-Speed Direct Cloud Download
Original untouched resource package hosted on 5TB unlimited Google Drive: