Elevate your data visualization with this dynamic infographic template, featuring a modern glass user interface. This clean and sleek design brings a sophisticated, professional aesthetic to any presentation, report, or project overview. The template showcases interactive-style elements such as animated progress bars that dynamically fill to indicate completion, customizable checklists for tracking project steps, and percentage gauges for illustrating key metrics. Animated process flows and branding journeys provide clear, step-by-step explanations for complex information. The translucent, frosted glass effect adds a contemporary depth and visual appeal, making your data points stand out. Designed for ease of use, the template allows for simple drag-and-drop customization of text, colors, and values, ensuring it seamlessly integrates with your brand. Perfect for corporate presentations, marketing reports, educational content, or any scenario requiring clear, engaging data representation, this template transforms raw data into compelling visual stories.
Explore more high-quality resources in our Graphics & Illustrations library, and pair them with curated Graphic Templates and Web & Site Templates for your digital creations.
📋 Asset Specifications & Compatibility
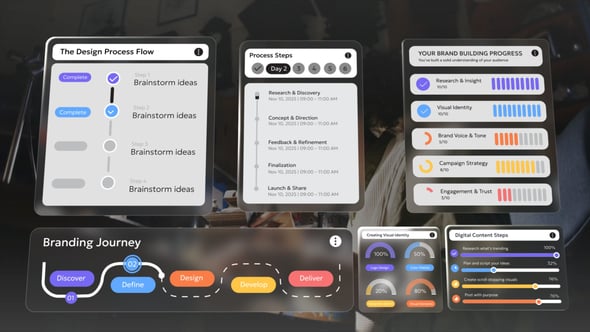
Original creative preview & visual showcase
⚡ High-Speed Direct Cloud Download
Original untouched resource package hosted on 5TB unlimited Google Drive: