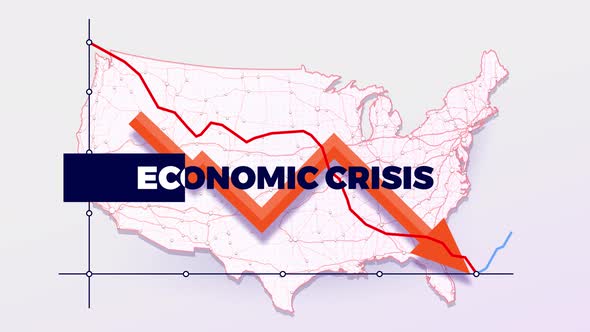
A dynamic data visualization illustrates an economic downturn over a map of the United States. A clean, modern aesthetic with a stark color palette of red and blue accents against a subtle USA map background highlights the severity of the crisis. The graph shows a clear downward trend, reinforced by a prominent orange arrow. This animated clip effectively illustrates financial challenges or market crashes, making it suitable for news broadcasts, corporate presentations, educational content, or any project needing to convey economic hardship with compelling visuals. It provides a striking visual metaphor for declining financial indicators.
Explore more high-quality resources in our Graphics & Illustrations library, and pair them with curated Graphic Templates and Web & Site Templates for your digital creations.
📋 Asset Specifications & Compatibility
Original creative preview & visual showcase
⚡ High-Speed Direct Cloud Download
Original untouched resource package hosted on 5TB unlimited Google Drive: